✅ Exam Format: The GMAT Focus Edition offers a shorter format by removing the essay section and focusing on quantitative and verbal areas.
✅ Scoring System: Both versions assess quantitative and verbal skills, but the Focus Edition excludes the essay score.
✅ Preparation Focus: Candidates for the Focus Edition can study fewer sections, saving time and simplifying prep.
✅ Cost & Duration: The Focus Edition is more affordable and shorter, making it ideal for cost-conscious test-takers.
If you’re trying to understand the difference between the GMAT Focus Edition and the old GMAT, you’re not alone. Many business-school applicants search for which GMAT version is better, which one is easier, and what has changed in the new exam. Both tests are accepted by top MBA programs, but the format, scoring, and section structure are not the same.
The GMAT Focus Edition was launched on November 7, 2023, while the classic GMAT is available only until January 31, 2024. Because of this change, students want clear answers about which test to take, how the scoring works, and what makes the two exams different. This introduction will help you quickly understand the major differences so you can choose the GMAT version that fits your study style and career goals.
The GMAT Score Scale: New Updates
If you're familiar with the previous version of the GMAT, the GMAT Exam (10th Edition), you’ll notice a key difference in the total score scale. For the GMAT 10th edition, these numbers ranged from 200 to 800. However, all the GMAT Focus Edition scores end in a 5, ranging from 205 to 805, making it easier to distinguish between the two exam editions.
The test scoring system is updated better to reflect the diverse range of scores from test-takers today. Over the years, scores have shifted significantly, resulting in an uneven distribution. The updated score scale fixes that. The new system will provide a more detailed view of test performance, making it fairer for everyone.
In addition to the score scale update, the following key changes distinguish the GMAT Exam (Focus Edition):
The Total Score is now comprised of all 3 section scores. Before, your Total Score was only based on two sections: Quantitative and Verbal Reasoning. Now, the new total Score will be based on three sections: Quantitative, Verbal, and Data Insights.
The scoring algorithm has been updated.
The content areas and test constructs have been refined to narrow the scope to focus on data literacy, critical thinking, and problem-solving skills.
The new Question Review & Edit feature will have implications for testing behavior.
Percentile Rankings
The adjustments in the GMAT focus edition vs GMAT scale clearly reflect on the percentile rankings as well. These rankings show how your score compares to other test-takers.
For instance, if you’re in the 70th percentile, you scored better than 70% of candidates, while the remaining 30% outperformed you. This updated section-wise percentile table will help you understand where you stand relative to the current pool of GMAT test-takers.
Disclaimer: The direct comparisons of the GMAT Focus Edition vs the GMAT aren’t that straightforward. A score that might have placed you in the 80th percentile on the traditional GMAT could translate differently on the Focus Edition scale.
Data Insights
Data Insights section is a new addition to the GMAT exam and assesses a candidate’s ability to analyze, interpret, and apply data to real-world scenarios.
It consists of 20 multiple-choice questions to be completed in 45 minutes. The question types include Data Sufficiency, Multi-Source Reasoning, Table Analysis, Graphics Interpretation, and Two-Part Analysis. Data Insights scores range from 60 to 90, which is determined by several factors:
The number of questions answered
The accuracy of responses
The difficulty level of the questions
Some questions may have multiple parts, and all parts must be answered correctly to receive credit for that question.
Score
Percentile Ranking
90
100%
85
99%
80
86%
75
51%
70
24%
65
10%
60
4%
Verbal Reasoning
This section evaluates a candidate’s ability to read and understand written material, reason and evaluate arguments, and correct written material to conform to standard written English.
It comprises 36 multiple-choice questions to be completed in 65 minutes. The question types include Reading Comprehension, Critical Reasoning, and Sentence Correction.
Verbal Reasoning scores range from 6 to 51, which is determined based on the number of questions answered correctly, the difficulty level of those questions, and other statistical parameters.
Score
Percentile Ranking
90
100%
85
96%
80
60%
75
19%
70
4%
65
1%
60
0%
Quantitative Reasoning
This section measures a candidate’s ability to reason quantitatively, solve quantitative problems, and interpret graphic data. It includes 31 multiple-choice questions to be completed in 62 minutes. The questions are of two types: Problem Solving and Data Sufficiency.
Quantitative Reasoning scores also range from 6 to 51 and are determined based on the number of correct responses, the difficulty of the questions answered, and the question's parameters. The impact of your Quantitative Reasoning performance on your GMAT focus edition vs GMAT is huge, especially if you’re aiming for a higher percentile.
Score
Percentile Ranking
90
100%
85
89%
80
66%
75
35%
70
14%
65
4%
60
1%
Total Score
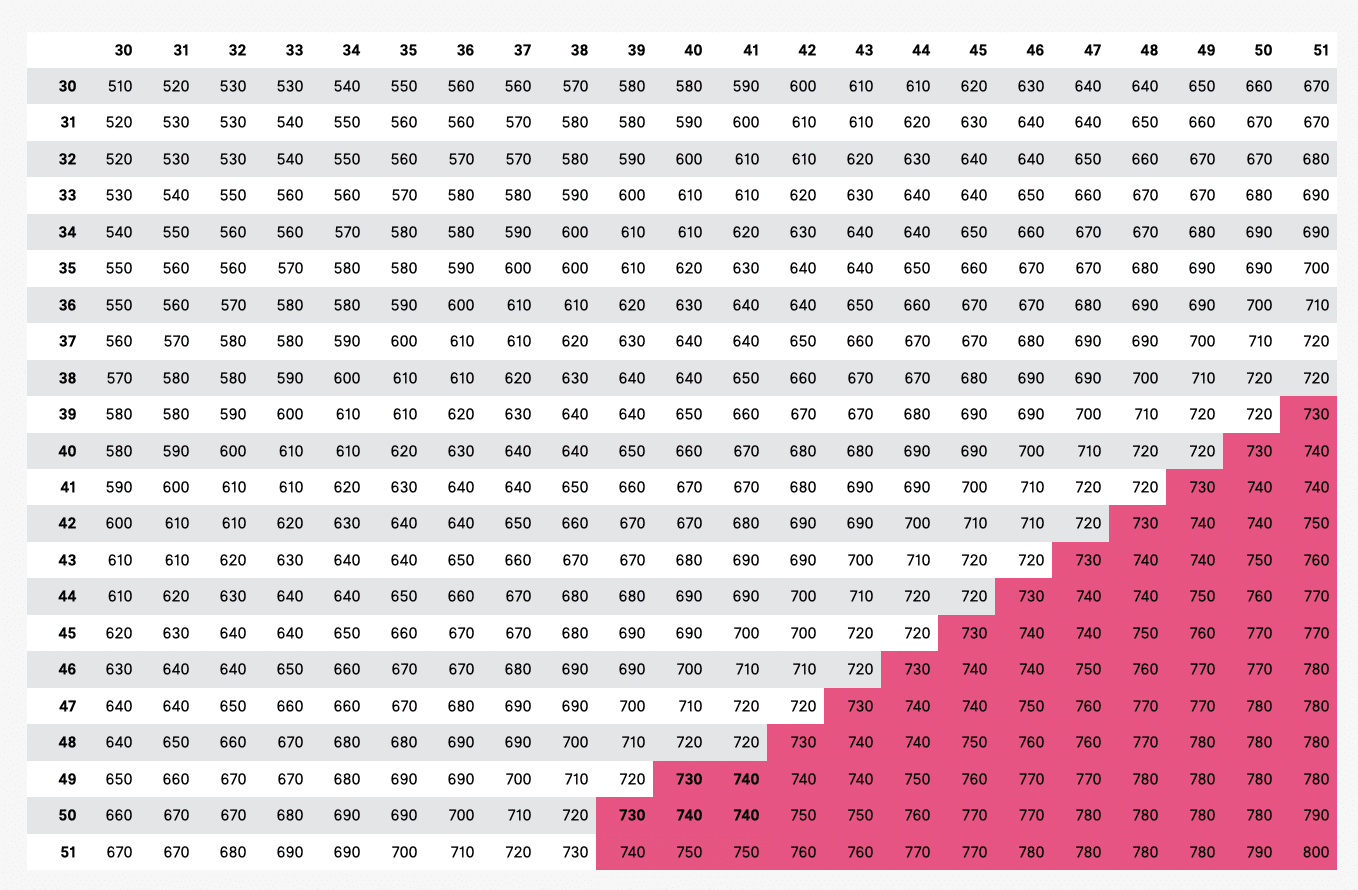
Your total GMAT Focus Edition score is an aggregate of the scores in the individual sections - Quant, Verbal, and Data Insights. This range scales from 205 to 805 with each section contributing equally to the total score and eventually the percentile ranking.
Score
Percentile Ranking
805
100%
755
100%
705
99%
655
93%
605
75%
555
53%
505
31%
455
17%
405
8%
355
3%
305
1%
255
0%
205
0%
GMAT Focus Edition vs GMAT Concordance
As already mentioned above, the GMAT Focus total score ranges from 205 to 805. Earlier, this range (in GMAT 10th Edition) used to be 200 to 800. This seemingly minor change renders the direct comparison of the GMAT focus edition vs GMAT inaccurate and meaningless.
That's why when assessing your relative competitiveness, it’s better to compare your percentile rankings rather than the raw scores. This approach will give you a clearer picture of where you stand among other test-takers.
Below is the GMAT focus edition vs GMAT scale concordance table that will help you understand how the percentile distributions align between the two versions of the exam.
GMAT (10th Edition)
GMAT Focus Edition
Percentile Ranking
800 - 770
805 - 735
100% - 99.7%
760 - 730
735 - 675
99.5% - 96.1%
720 - 690
675 - 635
95.2% - 85.1%
680 - 650
635 - 595
83.5% - 71.5%
640 - 610
595 - 565
70.7% - 55.8%
600 - 570
565 - 535
55.1% - 43.8%
560 - 530
535 - 495
41.1% - 28.5%
520 - 490
495 - 475
28.5% - 22.4%
480 - 450
475 - 445
21.1% - 14.1%
440 - 410
445 - 425
13.9% - 10.4%
400 - 370
425 - 395
9.4% - 6.7%
360 - 330
395 - 375
6.2% - 4.2%
320 - 290
375 - 345
3.7% - 2.4%
280 - 250
345 - 315
2.2% - 1.4%
240 - 200
315 - 205
1.3% - 0.1%
To make the most of this GMAT focus edition vs GMAT concordance table, translate your old GMAT score into its equivalent on the Focus Edition scale.
This will help you understand how your performance stacks up in the current testing landscape, ensuring you're accurately assessing your competitiveness based on the updated percentile rankings.
What is The Importance of GMAT Exam?
Impact of GMAT Focus Edition Changes on MBA Applications
The transition from the GMAT 10th Edition to the Focus Edition has not only altered the exam score scale but also reshaped how scores are interpreted by admissions committees.
Here’s a closer look at the implications of these changes on your MBA applications, particularly w.r.t. the GMAT focus edition vs GMAT adjustments.
Some schools are still recalibrating their admission criteria to the new scoring systems. This transition may give you more flexibility in choosing which exam to take for the time being.
Admission committees are starting to place greater emphasis on percentile ranking than on comparing raw GMAT Focus Edition vs GMAT.
As GMAT scores often factor into business school rankings, the shift to the Focus Edition may temporarily impact how schools are ranked, and thus your list of “target” business schools.
For candidates, adapting to the Focus Edition early will demonstrate their adaptability and willingness to embrace changes – qualities highly valued in business leadership.
Utilize the above GMAT vs Focus Edition score concordance tables to benchmark your performance and accurately assess where you stand in the competition.
The transition from the GMAT 10th Edition to the GMAT Focus Edition represents a significant shift in how scores are calculated and interpreted. With the new GMAT vs Focus Edition score scale adjustments, it's essential to understand how these changes reflect your performance and impact your MBA applications.
The GMAT vs Focus Edition score concordance tables provided in this guide offer valuable insights into how scores from the old and new editions correlate, helping you evaluate your position relative to other test-takers.
What is the GMAT Focus Edition, and how does its scoring differ from the traditional GMAT?
The GMAT Focus Edition is the updated version of the traditional GMAT, featuring a new score scale ranging from 205 to 805, compared to the 200 to 800 range in the previous version. The Focus Edition also introduces the Data Insights section, which assesses data literacy—a critical skill in today’s business environment. This new scoring system is designed to better reflect the performance of modern test-takers and provide a more detailed assessment for business schools.
How do I know if my GMAT Focus Edition score is competitive for MBA programs?
To gauge the competitiveness of your GMAT Focus Edition score, look at percentile rankings rather than just the raw score. Percentiles show how your score compares to other test-takers. For example, a score of 645 on the GMAT Focus Edition might place you in the same percentile as a 700 on the old GMAT.
Using the GMAT vs Focus Edition score concordance table can help you translate your performance into a meaningful context for MBA applications.
Should I be concerned about how MBA admissions committees will view my GMAT Focus Edition score?
While the GMAT Focus Edition is relatively new, MBA admissions committees are adapting quickly to the changes. In fact, they may place more weight on percentile rankings from the Focus Edition, which offers a clearer picture of your relative performance compared to other applicants. Familiarizing yourself with the new scoring system and how it compares to the traditional GMAT will help you better position your application.
Are Quant and Verbal harder in the GMAT Focus Edition than before?
No, the difficulty level remains similar. What’s changed is the structure. Quant now focuses more on reasoning and fewer heavy calculations. Verbal no longer includes sentence correction, making it simpler for many students. So, the sections feel cleaner and more focused, not harder.
Which exam gives a better chance to score high: GMAT or GMAT Focus Edition?
Many students find the GMAT Focus Edition easier to score well in because there are fewer questions, no essay, and the option to review and change answers. With smart strategy and steady practice, scoring higher becomes more achievable compared to the older, longer exam.
Is GMAT Focus Edition shorter than the old GMAT?
The Focus Edition takes around 2 hours 15 minutes, while the old GMAT took over 3 hours including the essay. The shorter duration reduces mental fatigue and gives a better overall test-taking experience, especially for students who struggle with long exams.
What is the Data Insights section in the GMAT Focus Edition?
Data Insights replaces Integrated Reasoning and includes new question styles. It tests how well you interpret charts, data sets, and logical scenarios. This section is important because business schools now value data-driven thinking for MBA and MiM programs.
Know Your Author
Abhyank Srinet
|
Study Abroad Expert
Abhyank Srinet, the founder of MiM-Essay, is a globally recognized expert in study abroad and admission consulting. His passion is helping students navigate the complex world of admissions and achieve their academic dreams. Abhyank earned a Master's degree in Management from ESCP Europe, where he developed his skills in data-driven marketing strategies, driving growth in some of the most competitive industries.
Abhyank has helped over 10,000+ students get into top business schools with a 98% success rate over the last seven years. He and his team offer thorough research, careful shortlisting, and efficient application management from a single platform.
His dedication to education also led him to create MentR-Me, an AI-powered platform that offers personalized guidance and resources, including profile evaluation, application assistance, and mentoring from alumni of top global institutions.
Continuously adopting the latest strategies, Abhyank is committed to ensuring that his clients receive the most effective guidance. His profound insights, extensive experience, and unwavering dedication have helped his clients securing of over 100 crores in scholarships, making him an invaluable asset for individuals aiming to advance their education and careers and leading both his ventures to seven-figure revenues.


.jpg)